Biomedical Instrumentation was one of the most fascinating courses we had at the undergraduate level. Since school days, I used to get amazed when I had to take some medical tests. Although we had some vague ideas about how x-ray or ultra-sonography from high school physics, still it was sort of a wonder how the ECG worked, what was behind those puzzling lines. It was in this course, that we were introduced to the realm of Biomedical Engineering. And when we were asked to do a project for the sessional, without doubt, I was getting excited. We were a group of five, and ideas started to flow in. Most of them proved to be out of the question though, like EEG for very low voltage level, or eye motion controlled mouse etc. But still the hopes were high, and we decided to make a polygraph machine.
The polygraph machine usually takes into account several biological parameters like heart rate, breathing rate, perspiration, movement of different body parts like eyes, arms and legs. When under interrogation, if some of them changes rapidly, it is an indication of a possible lie from a person. This sort of system is quite costly and only available to detective agencies. But our budget was low and there was the time constraint, so we decided to take only two parameters: the heart rate obtained from ECG and the Galvanic Skin Resistance in the process of making a simple polygraph machine.
One crucial part in any biomedical project (which we seemed to realize later), is the choice of the electrode. Since the signal level is very low, the better the electrode, the better is the data acquisition and the easier will it be to remove of noise. At first we used the suction cup electrode, but it was soon recognized that the surface area was too low, so despite the strong contact, the signal was still of little use.

Fig: Suction Cup Electrode
So the ECG clamps, that was available at the laboratory was hired for ECG.

But the lab was in short supply to give two of these. So for GSR, we made an electrode by attaching aluminum foil with velcro, and the result was better than expected.
Galvanic Skin Resistance (GSR):
Components:
• IC-LM 358 – Amplifier
• BJT-2N2222
• LCD module and microcontroller (ATMEGA 32) - for display
• Some resistors and capacitors (0.1µf,0.33µf,1µf)
Fig: GSR Circuit
The circuit measures the skin resistance for range of values from 0K to 180K. This range can be changed if required. With the increase of resistance the output voltage changes from 0.65V to 3.75V. This range is sufficient for resistance measurement.
There are three operational amplifiers LM358 connected sequentially. The first amplifier is a voltage follower. The output of this is fed into the base and emitter of a BJT 2N222.
We know that for a BJT in forward bias
Ib α exp(VBE/VT)
Ie α exp(VBE/VT)
For constant voltage VBE the current through the BJT is constant. Therefore if the electrodes are placed in the collector than a constant current of few mA passes through the body. The body resistance is therefore proportional to the voltage drop across the collector. The Velcro electrodes were connected between two fingers.
This voltage was buffered into the second operational amplifier and then fed into a differential amplifier which has a constant voltage at the other input. The output was taken from the final op-amp output.
Since the output voltage is proportional to the body resistance the resistance can then be easily measured.
The output of the opamp is connected to the input in Port A of ATMEGA 32 with ADC value range of 0-5V. The output LED is shown through PortB. The other two ports of the uC, port C and port D was used to drive the LCD. For each input value a change is measured with the previous value. Based on the change the output LED is turned on
% Change in ADC (V) Corresponding Output LED Decision
0.01 1st Green Relaxed
0.3 2nd Green Comforting
0.5 1st Yellow Uneasy
0.8 2nd Yellow Uncomforting
1 3rd Yellow Tense
1.3 1st Red Excited
More than 1.3 2nd Red Hyper Excited
The LCD output shows the measured GSR value. From the readings the change can be observed. When the percentage change in GSR is more than 0.8 ‘LIE’ is printed.
Electrocardiogram (ECG):
The origin of ECG is at the membrane potential in the atria and the ventricle when they become active and recover. During Diastole, blood moves from atria to the ventricle. The atria compresses, the atria cells become active and positive and that voltage is found at the electrodes as the p waves. After that, comes the systole, in which the blood goes to the whole body through aorta and to the lungs through pulmonary vein. So at that time, the ventricle compresses and as the compression is higher than that of atria, the voltage found, QRS complex is higher than the p wave. After the QRS, the small t wave follows, which denotes the ventricular relaxation (Not really, the blood flow in the coronary arteries occurs at the same time of ventricular relaxation, so the voltage is positive instead being negative). If you ask where is the atrial relaxation, it is buried under QRS complex.
To detect the lie we measured Instantaneous Heart Rate (IHR) and compared it with the Mean Heart Rate (MHR). Any sudden change in heart rate indicates the possibility of lie.
In standard, there are 12 leads in the ECG.
Each of the 12 leads represents a particular orientation in space, as indicated below
(RA = right arm; LA = left arm, LF = left foot):
Bipolar limb leads (frontal plane):
Lead I: RA (-) to LA (+) (Right Left, or lateral)
Lead II: RA (-) to LF (+) (Superior Inferior)
Lead III: LA (-) to LF (+) (Superior Inferior)
Augmented uni-polar limb leads (frontal plane):
Lead aVR: RA (+) to [LA & LF] (-) (Rightward)
Lead aVL: LA (+) to [RA & LF] (-) (Leftward)
Lead aVF: LF (+) to [RA & LA] (-) (Inferior)
Uni-polar (+) chest leads (horizontal plane):
Leads V1, V2, V3: (Posterior Anterior)
Leads V4, V5, V6:(Right Left, or lateral)
Since, we only need the heart bit rate from the ECG, we only used lead II.
Components:
• AD 620- Low noise amplifier
• LM-358
• HA-741
• Some resistors and capacitors
Circuit:
The ECG circuit consists of several blocks which are:
1. Pre-amplifier Low Pass Filter
2. Main Amplifier
3. Post-amplifier two stage Butterworth Low pass filter
4. Amplifier for gain recovery


1. Pre-Amplifier Low Pass Filter:
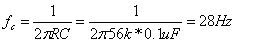
It has been used to exclude the 50 Hz signal predominantly available from the main line power. For two Inputs two passive RC low pass filter with cut off frequency of 28 Hz has been used.

There are three operational amplifiers LM358 connected sequentially. The first amplifier is a voltage follower. The output of this is fed into the base and emitter of a BJT 2N222.
We know that for a BJT in forward bias
Ib α exp(VBE/VT)
Ie α exp(VBE/VT)
For constant voltage VBE the current through the BJT is constant. Therefore if the electrodes are placed in the collector than a constant current of few mA passes through the body. The body resistance is therefore proportional to the voltage drop across the collector. The Velcro electrodes were connected between two fingers.
This voltage was buffered into the second operational amplifier and then fed into a differential amplifier which has a constant voltage at the other input. The output was taken from the final op-amp output.
Since the output voltage is proportional to the body resistance the resistance can then be easily measured.
The output of the opamp is connected to the input in Port A of ATMEGA 32 with ADC value range of 0-5V. The output LED is shown through PortB. The other two ports of the uC, port C and port D was used to drive the LCD. For each input value a change is measured with the previous value. Based on the change the output LED is turned on
% Change in ADC (V) Corresponding Output LED Decision
0.01 1st Green Relaxed
0.3 2nd Green Comforting
0.5 1st Yellow Uneasy
0.8 2nd Yellow Uncomforting
1 3rd Yellow Tense
1.3 1st Red Excited
More than 1.3 2nd Red Hyper Excited
The LCD output shows the measured GSR value. From the readings the change can be observed. When the percentage change in GSR is more than 0.8 ‘LIE’ is printed.
Electrocardiogram (ECG):
The origin of ECG is at the membrane potential in the atria and the ventricle when they become active and recover. During Diastole, blood moves from atria to the ventricle. The atria compresses, the atria cells become active and positive and that voltage is found at the electrodes as the p waves. After that, comes the systole, in which the blood goes to the whole body through aorta and to the lungs through pulmonary vein. So at that time, the ventricle compresses and as the compression is higher than that of atria, the voltage found, QRS complex is higher than the p wave. After the QRS, the small t wave follows, which denotes the ventricular relaxation (Not really, the blood flow in the coronary arteries occurs at the same time of ventricular relaxation, so the voltage is positive instead being negative). If you ask where is the atrial relaxation, it is buried under QRS complex.
To detect the lie we measured Instantaneous Heart Rate (IHR) and compared it with the Mean Heart Rate (MHR). Any sudden change in heart rate indicates the possibility of lie.
In standard, there are 12 leads in the ECG.
Each of the 12 leads represents a particular orientation in space, as indicated below
(RA = right arm; LA = left arm, LF = left foot):
Bipolar limb leads (frontal plane):
Lead I: RA (-) to LA (+) (Right Left, or lateral)
Lead II: RA (-) to LF (+) (Superior Inferior)
Lead III: LA (-) to LF (+) (Superior Inferior)
Augmented uni-polar limb leads (frontal plane):
Lead aVR: RA (+) to [LA & LF] (-) (Rightward)
Lead aVL: LA (+) to [RA & LF] (-) (Leftward)
Lead aVF: LF (+) to [RA & LA] (-) (Inferior)
Uni-polar (+) chest leads (horizontal plane):
Leads V1, V2, V3: (Posterior Anterior)
Leads V4, V5, V6:(Right Left, or lateral)
Since, we only need the heart bit rate from the ECG, we only used lead II.
Components:
• AD 620- Low noise amplifier
• LM-358
• HA-741
• Some resistors and capacitors
Circuit:
The ECG circuit consists of several blocks which are:
1. Pre-amplifier Low Pass Filter
2. Main Amplifier
3. Post-amplifier two stage Butterworth Low pass filter
4. Amplifier for gain recovery
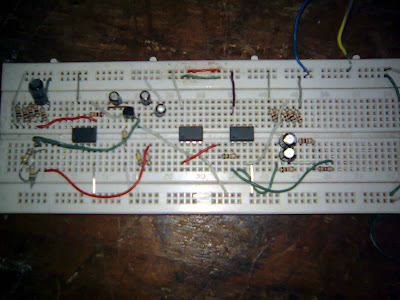
Fig: Complete ECG circuit
It has been used to exclude the 50 Hz signal predominantly available from the main line power. For two Inputs two passive RC low pass filter with cut off frequency of 28 Hz has been used.
Fig: Passive RC LPF
2. Main Amplifier:
The main Amplifier consists of AD620 amplifier. A resistance of 910 is used to adjust the gain.


The main Amplifier consists of AD620 amplifier. A resistance of 910 is used to adjust the gain.
Fig: Main Amplifier with AD 620
3. Post Amplifier two stage Butterworth Low Pass Filter:
Two -40dB/decade Butterworth filter with cutoff frequency of 31Hz is added to get a -80 dB/decade LPF operation. It removes the noise from line power and amplifier operation.


3. Post Amplifier two stage Butterworth Low Pass Filter:
Two -40dB/decade Butterworth filter with cutoff frequency of 31Hz is added to get a -80 dB/decade LPF operation. It removes the noise from line power and amplifier operation.
Fig: Butterworth Filter
4. Amplifier for gain recovery:
Since the two Butterworth filter reduces the signal amplitude, so a post filter amplifier is used with LM358 and a gain of 11.


Since the two Butterworth filter reduces the signal amplitude, so a post filter amplifier is used with LM358 and a gain of 11.
Fig: Amplifier with LM358
Real Time Data Acquisition:
The data acquisition was done with the sound card which takes analog signals as input. Initially the data is sampled at 22 KHz. Since this much sampling is sufficient to capture the analog signal it is resampled so that the code does not become slow when processing the data. If the processing time exceeds 1s then input signal can’t be read. So input signal is resampled at 16 KHz. In this samples there are data for 1sec. So each data block of 16000 samples correspond to 1sec of data. The total time for data acquisition can be set according to need by increasing the number of blocks.
Peak Detection:
Since the ECG signal is filled with 50 Hz interference signal to detect the peaks it should be considered that the noise does not affect the reading. For each data blocks the peak is found by comparing with the maximum value of the block. If the maximum value is found then the variable is shifted to 0.2 sec of samples because within this time there won’t be another peak. Initially there were errors because of fluctuation in reading additional peak samples were present. After the shift the error was reduced.
Hear Beat Rate:
Once the peak is determined the Mean Heart Rate is calculated. Since the mean heart rate varies for a person in normal condition the average of previous five heart rate is calculated. Based on this average the heart beat change can be obtained.
Since we know that Instantaneous Heart Rate provides indication of the Autonomic Nervous System the beat-to-beat variation of the cardiac cycle is also plotted simultaneously. If the R-R interval is more or less than a threshold value then it is marked in the plot with different colours. The threshold is calculated from previous mean values.
Result:
The result was somewhat acceptable. The polygraph machine was correct for about 50% of the time. But it could not differentiate an exhausted person, or an excited person for some else reason. So probably to have a better result, one needs to add more parameters like respiratory rate, or eye movement during interrogation.


6 comments:
gr8 blog iftekhar! descriptive and helpful...
This is a very good guide for me. I have to do a project for my final project in this college and i need to do an ECG and to calculate the skin resistance and the body temperature. Mind if you upload a bigger picture of ur shematic for the skin part? Also i was wndering if you could give me advise on what chip to use for the body temperature.
I was also wondering if i should use a power pack of 9volts and use the 7808 to bring down the voltage to 5 volts for the microcontroler.. I hope you could give me some advise because this will determine if i passe this semester! :D
Thanks Sajid.
@ Amin, You can use AD590 as the temperature transducer. It's a good practice to use 780X ICs to isolate your circuit from external interference but use large capacitors on either side, cause u don't want to burn your micro-controller. And it's better to use batteries instead of power supply for biomed projects.
Just go through the web and select the ics that match with your reqs. and price.
hi iftekhar, i have now fixed my temperature sensor and i am very happy. However, i am not catching how i could use the GSR,or even how the the output voltage i am receiving works. Heres a shematic i tried to do and its giving me 1.88volts at the output without me putting my 2 fingers. When i do, i see some random number like .80volts to 1.70 or somewhat... Could you help me out abit? am really late on this project.
btw heres the shematic i told you about.
http://courses.cit.cornell.edu/ee476/FinalProjects/s2007/jsc59_ecl37/jsc59_ecl37/img/GSR.gif
The modern EKG machine is much more streamlined and includes improvements such as computer analysis and in the near future could help prevent dangerous arrhythmias by stimulating the vagus nerve, delivering drugs, or defibrillating the heart.
wet wipes
Post a Comment